


In our previous blog posts we outlined how to implement CrowdSec in conjunction with Traefik as reverse proxy. Furthermore, we showcased how to parse Traefik logs via Promtail and visualizing those logs with Loki in Grafana.


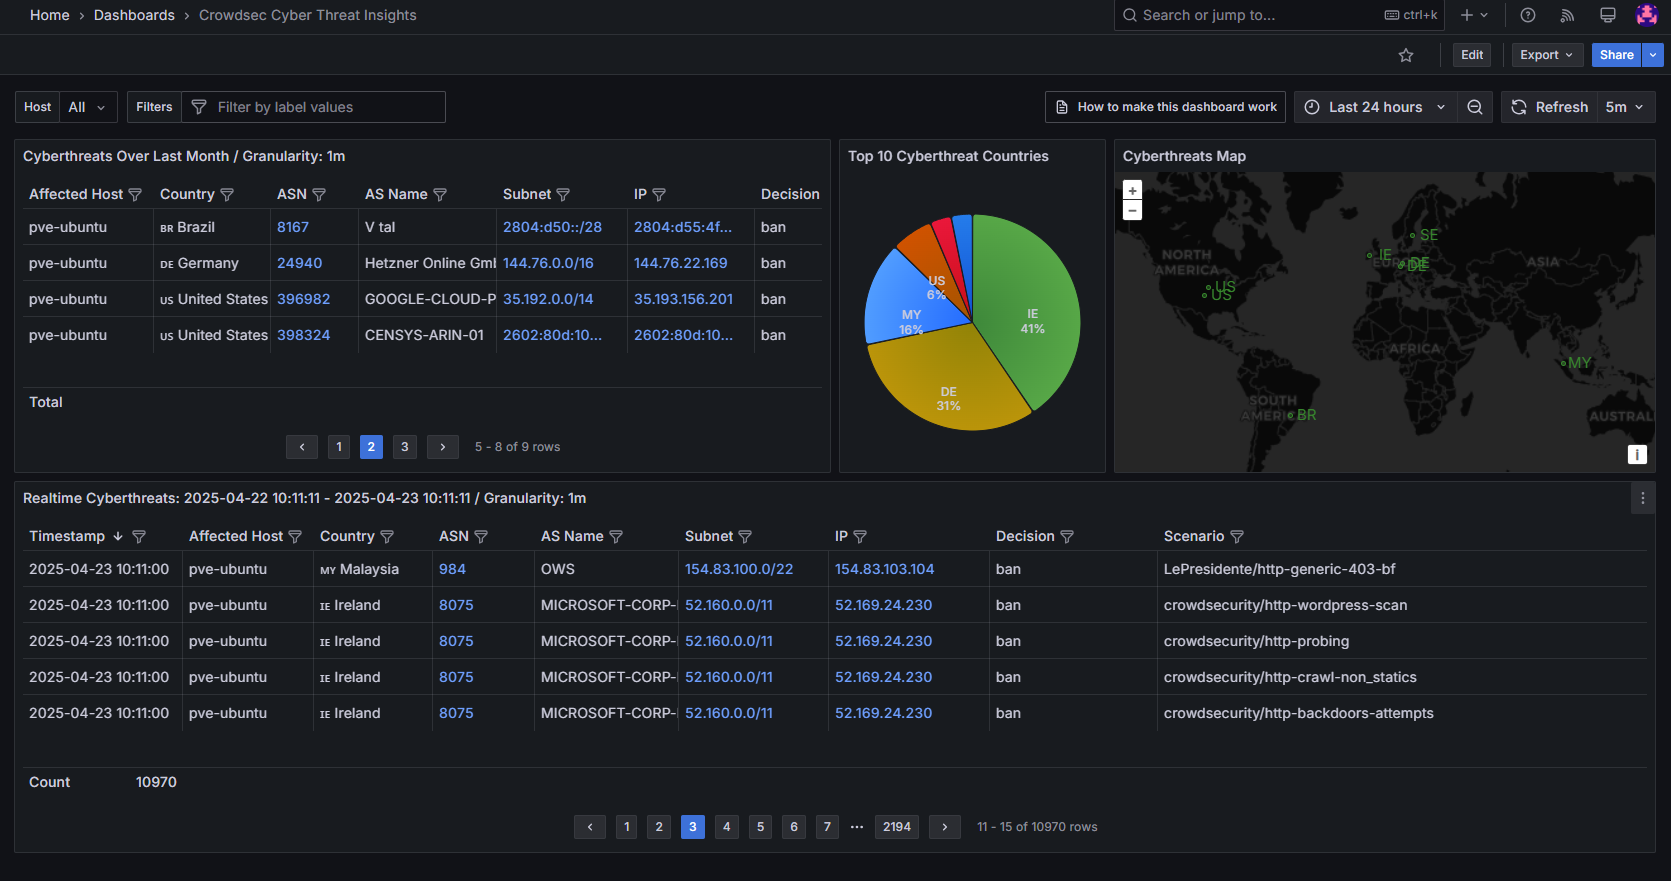
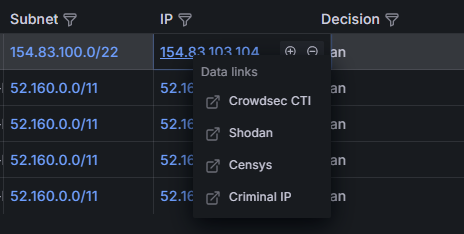
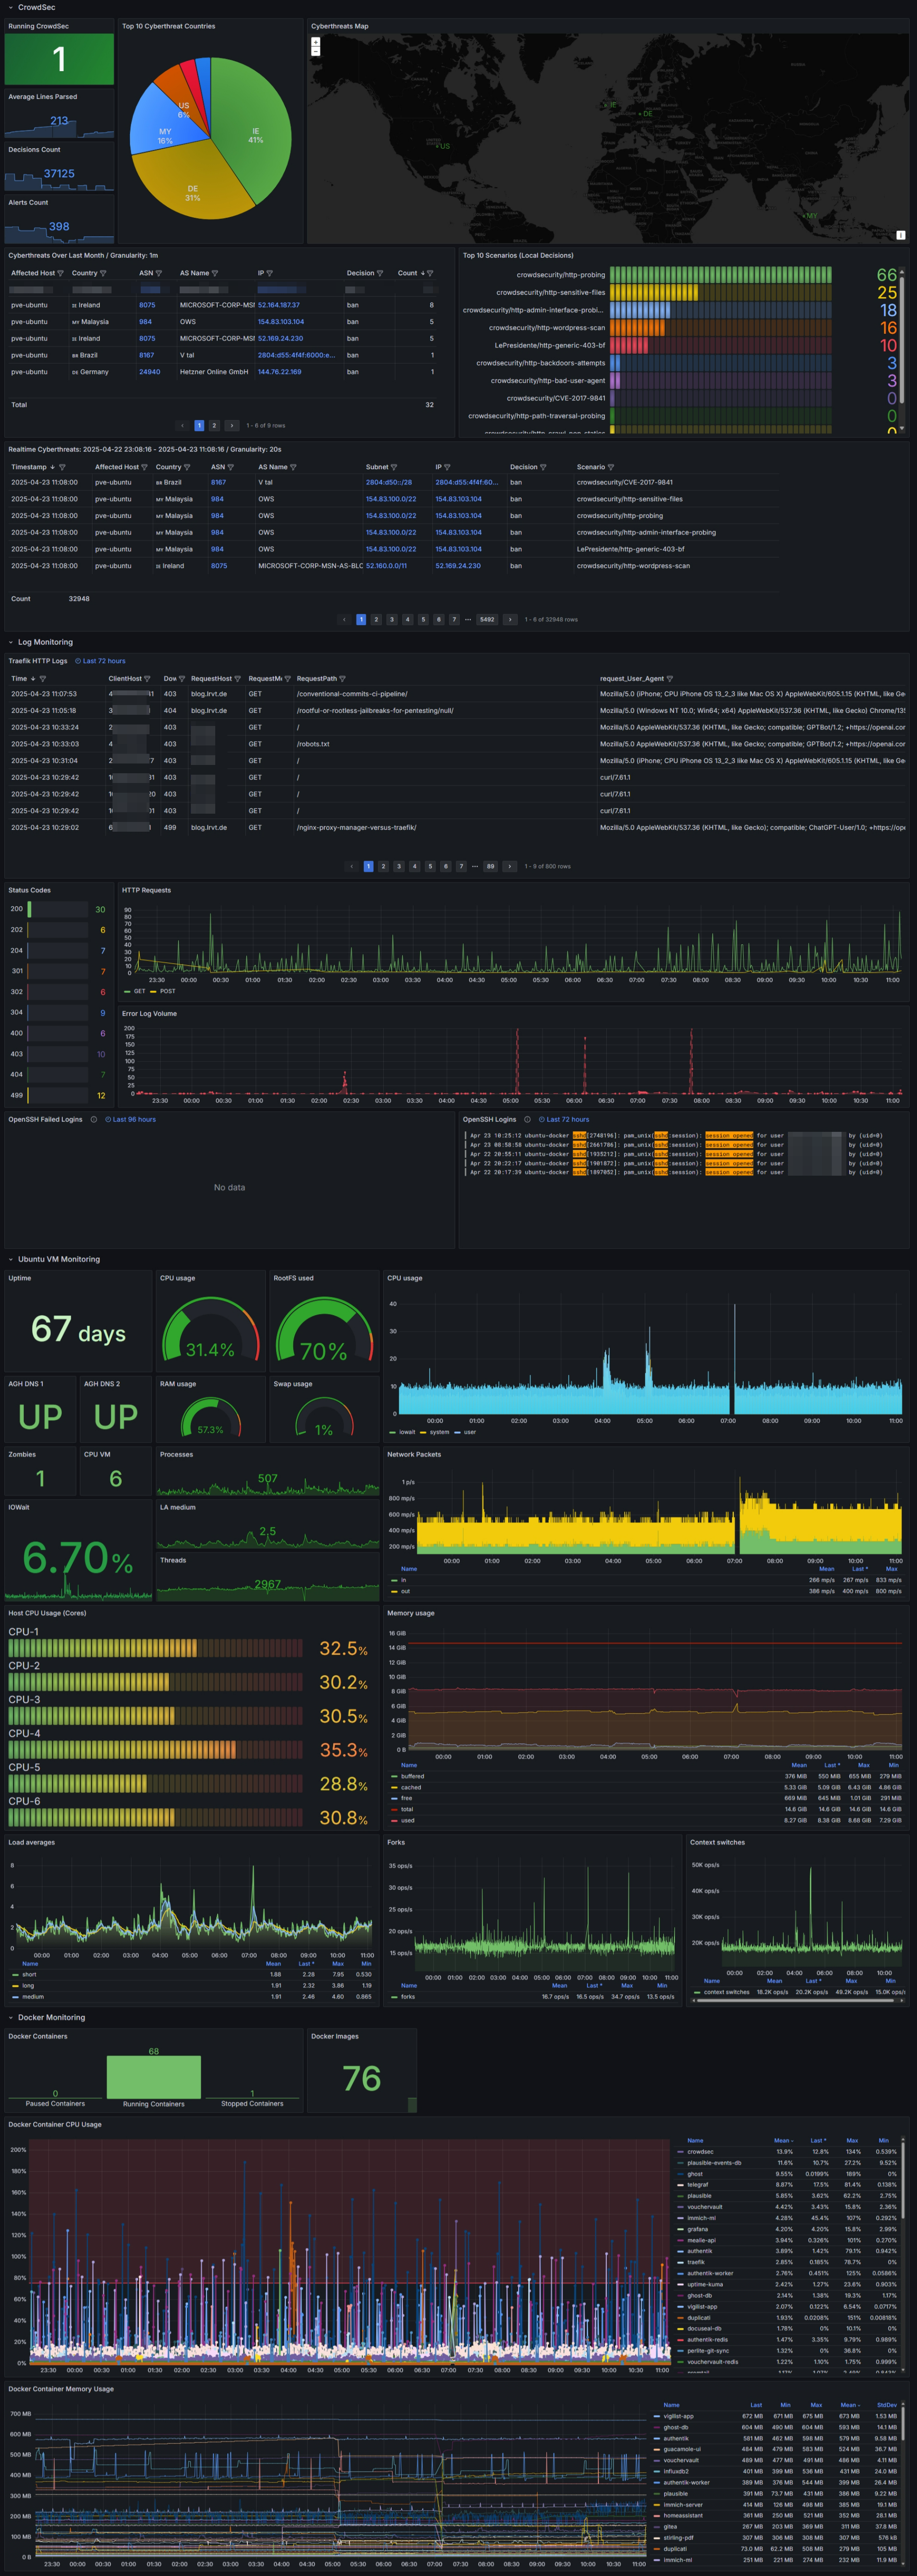
In today's blog post, we'll dive into parsing CrowdSec alerts and creating a self-hosted Cyber Threat Intelligence (CTI) dashboard using Grafana and VictoriaMetrics. This dashboard will visualize threat data, include direct links to CrowdSec's CTI, Shodan, Censys, and other external services for IP lookups, and feature an interactive world map.
Prerequisites
For this blog post I will assume that you are already running CrowdSec as well as a Grafana instance.
It does not really matter whether you have combined CrowdSec with Traefik or any other reverse proxy. Moreover, CrowdSec can be run as Docker container or be installed as baremetal service.
During the blog post, we will spawn a new container service called VictoriaMetrics (VM) and adjust some CrowdSec configuration files. Finally, we import an already existing Grafana dashboard, which visualizes CrowdSec's alerts as Threat Intelligence dashboard.
Spawning VictoriaMetrics
CrowdSec itself already provides a Prometheus HTTP endpoint to obtain logs and stats about decisions. However, the data provided is quite limited and cannot be compared to the advanced details e.g. available on the proprietary CrowdSec Console dashboard at https://app.crowdsec.net/ or returned for specific cscli commands.
Due to this reason, we will spawn VictoriaMetrics (VM). VM provides us with a selfhosted monitoring solution similar to Prometheus, offering high performance, efficient storage and API support to store our CrowdSec alerts programmatically.
Therefore, we will use it as data broker. Receiving JSON data from our CrowdSec instance and making the metrics available as Prometheus API to Grafana.
Docker Compose for VM
VictoriaMetrics can be easily spawned using Docker Compose.
Please ensure to put the container service in the same Docker network as your running Grafana and CrowdSec instances. This way, you can utilize Docker networking and must not map or expose any container ports of VictoriaMetrics to your underlying host. In my case, the external Docker network is called crowdsec_grafana.
services:

  victoriametrics:
    image: victoriametrics/victoria-metrics:v1.119.0
    expose:
      - 8428 # VM UI
    volumes:
      - vmdata:/storage
    command:
      - "--storageDataPath=/storage"
      - "--httpListenAddr=:8428"
    restart: always
    networks:
      - crowdsec_grafana

networks:
  crowdsec_grafana:
    external: true

volumes:
  vmdata: {}
Afterwards, you can spawn VM via the following means:
docker compose up -dAnd that's it. VictoriaMetrics is running in its own Docker network and waits for alert data feeded in via the http://victoriametrics:8428/api/v1/import URL by CrowdSec. No authentication required and only exposed to other containers running in the same network crowdsec_grafana.
Adjusting CrowdSec
In order to feed alerts into VictoriaMetrics, we must adjust the active configuration of our CrowdSec instance. We will create a new notification handler called victoriametrics.yaml and adjust our profiles.yaml to make use of it.
If you run CrowdSec as Docker container (e.g. by following my previous blog post), you can find the configuration files at your volume bind mounts that were defined in the CrowdSec Docker Compose project.
Typically, the data is stored at the following areas:
- Within CrowdSec's Docker container:
- /etc/notifications/victoriametrics.yaml
- /etc/profiles.yaml
- At CrowdSec's volume bind mounts (based on my previous blog post):
- /mnt/docker-volumes/crowdsec/etc/notifications/victoriametrics.yaml
- /mnt/docker-volumes/crowdsec/etc/profiles.yaml
- For baremetal installations:
- /etc/crowdsec/notifications/victoriametrics.yaml
- /etc/crowdsec/profiles.yaml
Creating a New Notification Handler
The first step is creating a new notification handler.
For this, we will create a new file called victoriametrics.yaml within CrowdSec's notification directory.
type: http
name: http_victoriametrics
log_level: debug
format: >
  {{- range $Alert := . -}}
  {{- $traefikRouters := GetMeta . "traefik_router_name" -}}
  {{- range .Decisions -}}
  {"metric":{"__name__":"cs_lapi_decision","instance":"my-instance","country":"{{$Alert.Source.Cn}}","asname":"{{$Alert.Source.AsName}}","asnumber":"{{$Alert.Source.AsNumber}}","latitude":"{{$Alert.Source.Latitude}}","longitude":"{{$Alert.Source.Longitude}}","iprange":"{{$Alert.Source.Range}}","scenario":"{{.Scenario}}","type":"{{.Type}}","duration":"{{.Duration}}","scope":"{{.Scope}}","ip":"{{.Value}}","traefik_routers":{{ printf "%q" ($traefikRouters | uniq | join ",")}}},"values": [1],"timestamps":[{{now|unixEpoch}}000]}
  {{- end }}
  {{- end -}}
url: http://victoriametrics:8428/api/v1/import
method: POST
headers:
  Content-Type: application/json
  # if you use vmauth as proxy, please uncomment next line and add your token
  #Authorization: "<SECRET-TOKEN>"
/etc/notifications/victoriametrics.yaml
my-instance to your preferred instance name. For example the hostname of the server that is protected by CrowdSec.Also adjust the URL
http://victoriametrics:8428/api/v1/import in case you run a different networking setup. If you follow this blog post and put VictoriaMetrics in the same Docker Network as CrowdSec and Grafana, it will work as outlined via the URL above. Docker will do the heavily lifting of networking and DNS resolving.In case you are implementing vmauth as proxy in front of VictoriaMetrics, you may want to uncomment the Authorization header line and add your secret token passphrase.
That's it. Via this notification handler, CrowdSec will happily format alert metrics and pass those along to our VictoriaMetrics container via its API endpoint running on TCP/8428.
traefik-logs injects such router labels as meta event key into CrowdSec alerts, which were not that straightforward to parse.If you want to read more about the painful process, see this GitHub issue. Many thanks to @LaurenceJJones from CrowdSec for his excellent help and hints.
Fun Fact: VictoriaMetrics does not like JSON arrays 🫠
Adjusting our CrowdSec Profile
Finally, we have to adjust our profiles.yaml in CrowdSec to enable our new notification handler. For this, we will open the profiles YAML file and add our new notification handler named http_victoriametrics at the key notifications.
The file should look like this:
name: default_ip_remediation
#debug: true
filters:
 - Alert.Remediation == true && Alert.GetScope() == "Ip"
decisions:
 - type: ban
   duration: 4h
#duration_expr: Sprintf('%dh', (GetDecisionsCount(Alert.GetValue()) + 1) * 4)
notifications:
 - http_victoriametrics
on_success: break
---
name: default_range_remediation
#debug: true
filters:
 - Alert.Remediation == true && Alert.GetScope() == "Range"
decisions:
 - type: ban
   duration: 4h
#duration_expr: Sprintf('%dh', (GetDecisionsCount(Alert.GetValue()) + 1) * 4)
notifications:
 - http_victoriametrics
on_success: break
/etc/profiles.yaml
http_victoriametrics to the mix. Your already existing notification channels should remain unchanged.Afterwards, we must restart CrowdSec:
# restarting via docker cli
docker container restart crowdsec

# restarting via docker compose
docker compose -f <path-to-crowdsec-compose> up -d --force-recreate

# restarting via systemctl on baremetal
systemctl restart crowdsec
Restarting CrowdSec
Installing GeoIP-Enrich Parser
Most CrowdSec instances come with the geoip-enrich parser installed as default. This one is necessary as we want to enrich banned IP addresses with geolocation data to display a world map in our Grafana dashboard later.
Although installed per default, we will verify that this is really the case for your instance. To do so, issue the following command:
# install parser via docker cli
docker exec -it crowdsec cscli parsers install crowdsecurity/geoip-enrich

# install parser via cscli on baremetal
cscli parsers install crowdsecurity/geoip-enrich
Installing geoip-enrich parser
Typically, it will report back Nothing to do - as already installed.
Setup Grafana Dashboard
If you already run your own Grafana instance, adding the new CrowdSec Threat Intelligence dashboard is very simple. You just have to import the already existing dashboard on GrafanaLabs.

Before doing so, we will add VictoriaMetrics as new data source though.
If you do not run Grafana yet, you may use this compose example:
services:

  grafana:
    image: grafana/grafana-oss:12.0.0
    container_name: grafana
    restart: unless-stopped
    user: 1000:1000 # your UID/GID
    environment:
      - GF_SERVER_ROOT_URL=https://grafana.example.com # your FQDN
    volumes:
      - ./volume-data/grafana:/var/lib/grafana
    ports:
      - 3000:3000
    expose:
      - 3000
    networks:
      - crowdsec_grafana

networks:
  crowdsec_grafana:
    external: true
Example Compose for Grafana
Add VictoriaMetrics as Data Source
- Log into your Grafana instance as admin
- Browse the datasources area at
/connections/datasources - Hit the button
Add new datasource - Chose
Prometheus - Define a name for your datasource; e.g.
victoriametrics - Define the URL
http://victoriametrics:8428 - Hit
Save and test
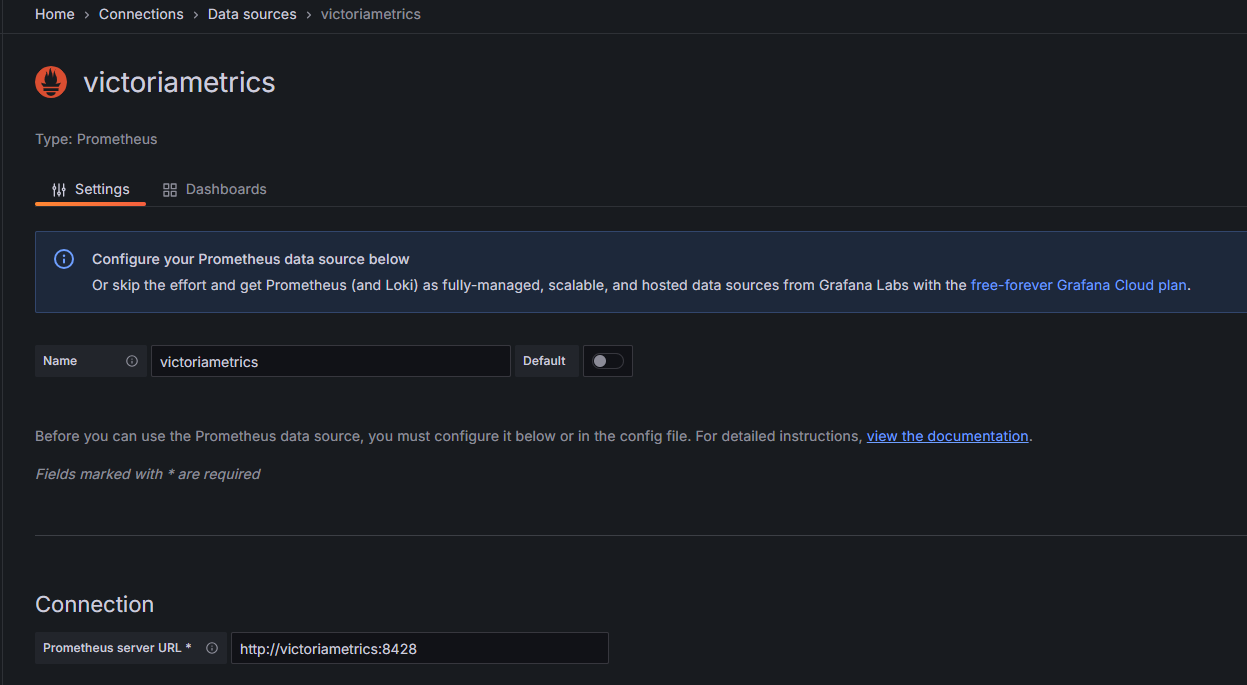
That's the reason such URL with just the service's hostname works. Although we have never mapped any ports of VictoriaMetrics to our underlying Docker host server.
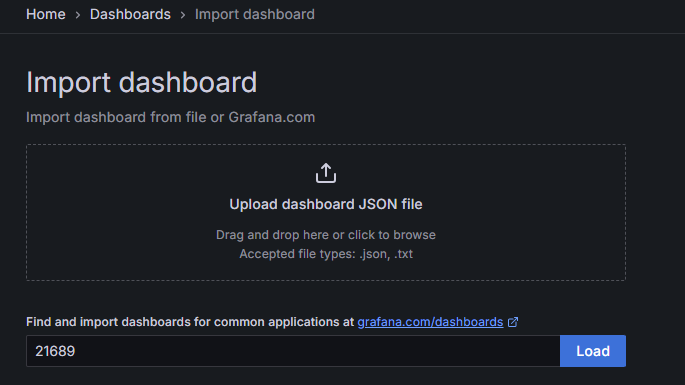
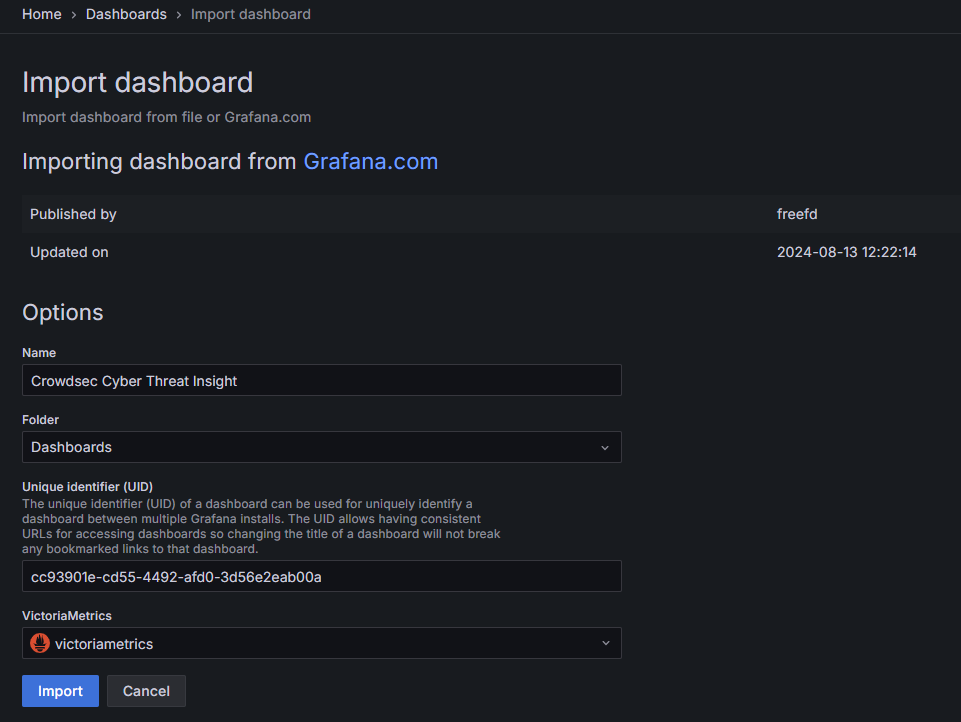
Importing the Dashboard
After adding VictoriaMetrics as new data source, we can proceed with importing the CrowdSec Threat Intelligence dashboard.
To do so, follow these steps:
- Log into your Grafana instance as admin
- Browse the dashboards area at
/dashboards - Hit the buttons
New > Import - Define the dashboard ID
21689from GrafanaLabs and hitLoad - Define a dashboard name like
Crowdsec Cyber Threat Insight - Define the previously created
victoriametricsdata source - Hit the button
Import
And that's basically it. You can now browse the newly imported dashboard and enjoy your CrowdSec Threat Intelligence feed. It may take some time for CrowdSec and the new notification handler to pass alert data into VictoriaMetrics. So take a break, get some coffee and check the dashboard at a later time again.
The Extra Mile
I've gone some extra steps and combined the dashboard with my already existing homelab dashboards (e.g. from other blog posts).
Now, I have a large Grafana dashboard that provides:
- Monitoring my Proxmox Ubuntu VM (resources, uptime, disks etc.)
- Monitoring my running Docker containers (CPU usage, memory usage, image count etc.)
- Parsing and filtering Traefik and OS logs via Loki (http, ssh etc.)
- Inspecting CrowdSec Threat Intelligence (TI) data (scenarios, banned IPs, etc.)
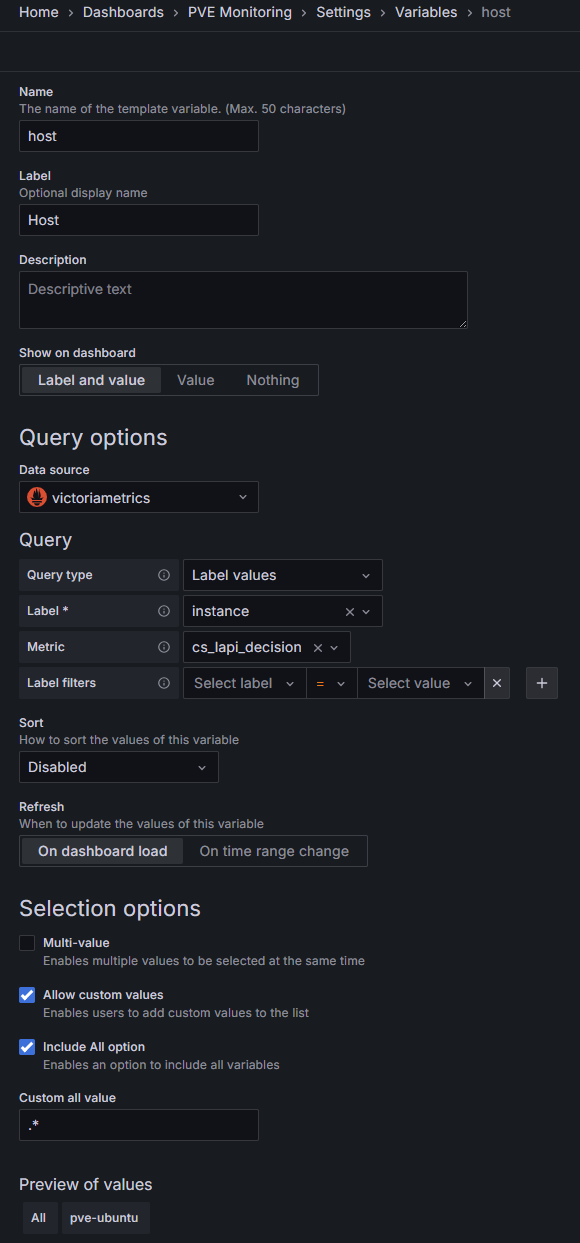
host from the imported CrowdSec TI dashboard at the other dashboards. Otherwise, filtering by instance name will not work natively and the tiles stay blank with no data. See this screenshot.


Discussion