


In my previous blog posts I outlined the necessary steps in order to create a monitoring dashboard with Grafana and various other software components such as Telegraf and InfluxDB. Moreover, I provided you guidance on how to use Grafana Loki as well as Promtail to visualize HTTP logs from Nginx Proxy Manager.
My older blog posts can be found here:


As I've changed my IT infrastructure to run Traefik as reverse proxy, the need to change my Grafana monitoring dashboard slightly arised. Especially, as Traefik natively supports pushing metrics directly into a database like InfluxDB.
Introduction
In today's blog post, I will provide you with detailed steps on how to activate metrics in Traefik v2 and push them into a containerized InfluxDB v1.8 database.
Moreover, we will enable logging of HTTP requests for Traefik and use Promtail to push them into Grafana Loki. Finally, we will configure the InfluxDB and Loki data sources in Grafana and import a pre-built monitoring dashboard by me to inspect Traefik metrics and HTTP logs.
The dashboard will look something like this in the end:
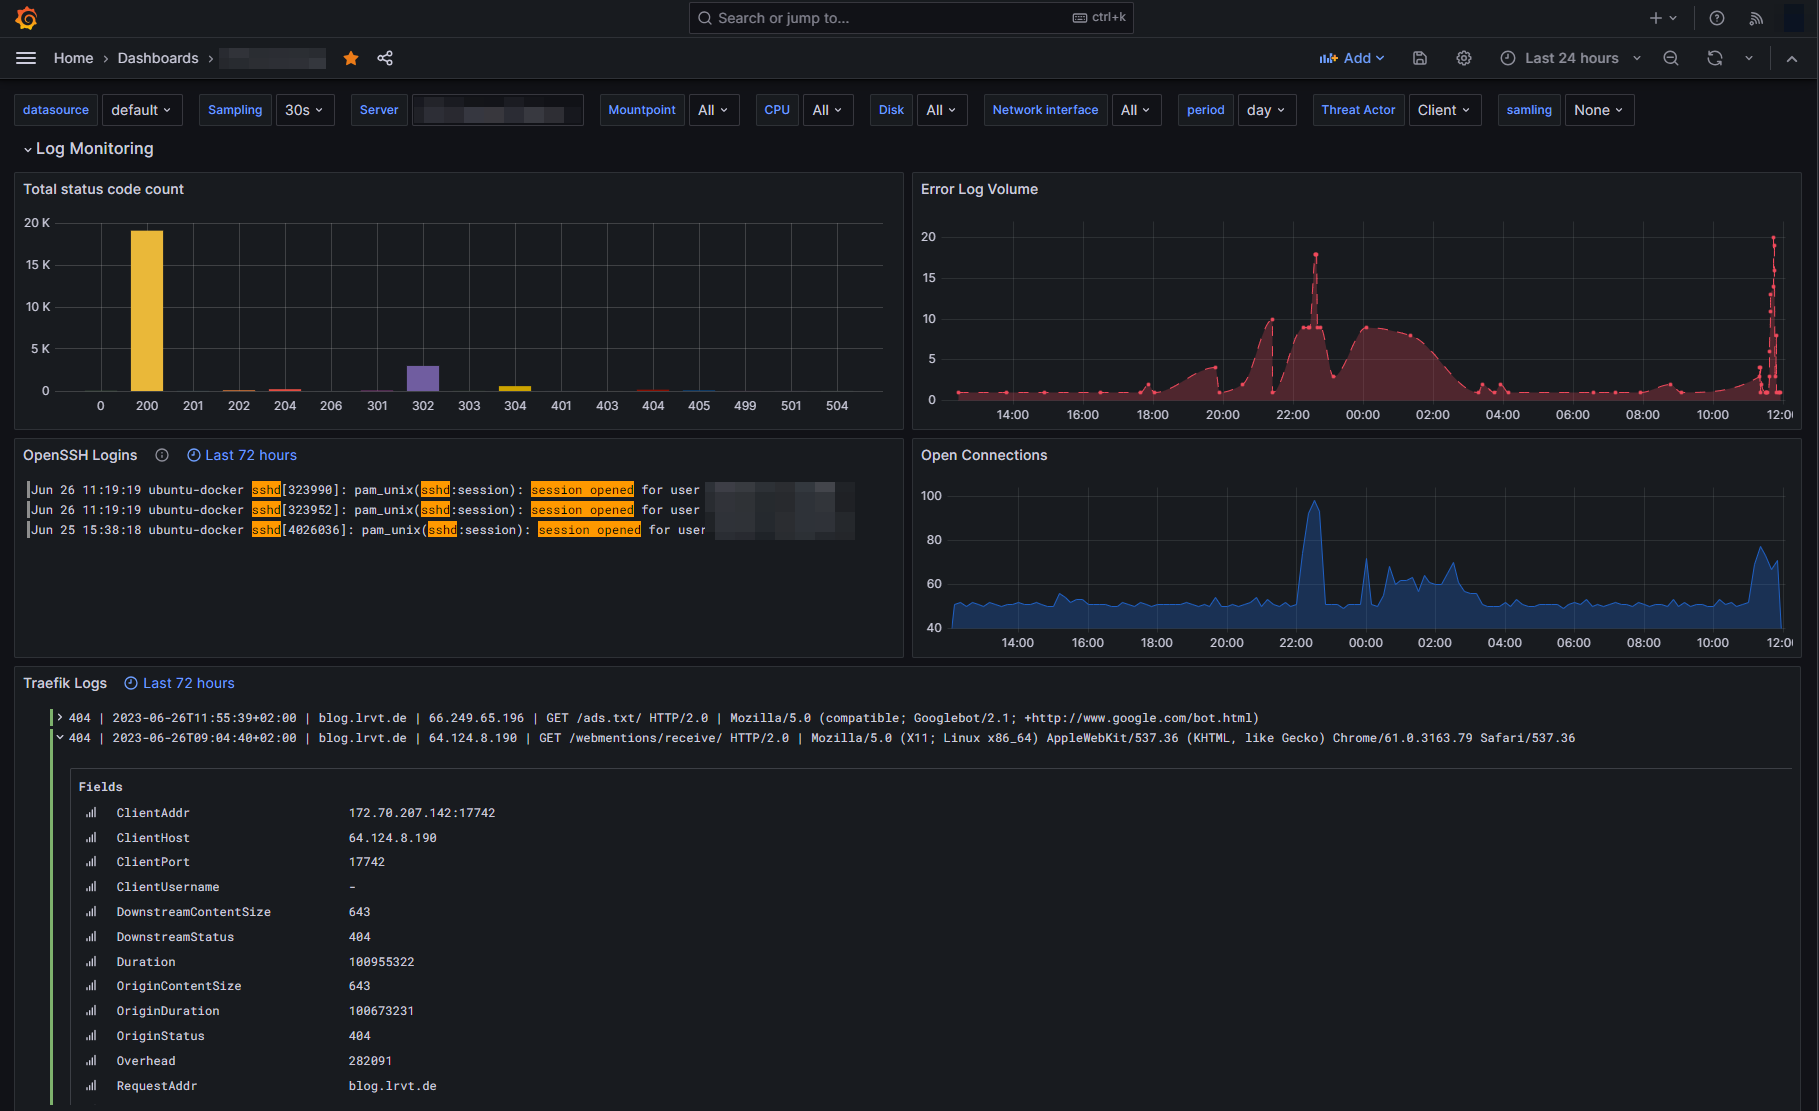
Configuring Container Services
This section contains the mandatory configuration steps for Traefik, InfluxDB as well as Promtail and Grafana Loki.
The general docker-compose.yml file we will be using is the following:
version: "3"

services:

  influxdb:
    image: influxdb:1.8.10
    container_name: influxdb
    hostname: influxdb
    restart: unless-stopped
    volumes:
      - /mnt/docker-volumes/influxdb/data:/var/lib/influxdb
      - /mnt/docker-volumes/influxdb/influxdb.conf:/etc/influxdb/influxdb.conf:ro
      - /mnt/docker-volumes/influxdb/init:/docker-entrypoint-initdb.d
    environment:
      - INFLUXDB_ADMIN_USER=admin
      - INFLUXDB_ADMIN_PASSWORD=MyVeryStrongAdminPassword

  loki:
      image: grafana/loki:2.9.10
      hostname: loki
      container_name: loki
      volumes:
      - /mnt/docker-volumes/loki:/etc/loki
      ports:
       - "127.0.0.1:3100:3100"
      restart: unless-stopped
      user: 1000:1000
      command: -config.file=/etc/loki/loki-config.yml

  promtail:
    image: grafana/promtail:latest
    container_name: promtail
    depends_on:
      - loki
    hostname: promtail
    volumes:
      - /var/log:/var/log
      - /mnt/docker-volumes/promtail:/etc/promtail
      - /mnt/docker-volumes/traefik/logs:/var/log/traefik
    restart: unless-stopped
    command: -config.file=/etc/promtail/promtail-config.yml

  grafana:
    image: grafana/grafana:latest
    container_name: grafana
    hostname: grafana
    restart: unless-stopped
    user: 1000:1000 # please adjust
    depends_on:
      - influxdb
      - loki
    volumes:
      - /mnt/docker-volumes/grafana:/var/lib/grafana
    environment:
      - GF_SERVER_ROOT_URL=http://grafana.example.com # please adjust
    ports:
      - 3000:3000
docker-compose.yml
As can be seen in the above YML file, we have configured various volume mounts holding our configuration files for the services. In my case, all volume mounts are located at /mnt/docker-volumes/<container-name>. Adjust to your infrastructure setup if needed.
In the following we will discuss the necessary configuration steps for all container services.
Traefik
For this blog post I will not go into detail on how to configure and setup a full-blown, dockerized Traefik instance. If you do not have a Traefik instance yet, may head over to my GitHub repository, which holds all necessary things.
However, in order to push Traefik metrics into an InfluxDB database, you must adjust your static configuration file of Traefik. Add the following code snippet:
metrics:
  influxDB:
    address: http://influxdb:8086
    protocol: http
    database: traefik
    username: traefikuser
    password: MyVeryStrongInfluxdbPassword
    addRoutersLabels: true
    addServicesLabels: true
    pushInterval: 60s
enabling Traefik metrics - traefik.yml
Furthermore, we have to enable access logs for Traefik. To enable access logs for Traefik, adjust your static configuration file again and add the following lines:
accessLog:
  filePath: "/logs/traefik.log"
  format: json
  filters:
    statusCodes:
      #- "200"
      - "400-599"
  # collect logs as in-memory buffer before writing into log file
  bufferingSize: 0
  fields:
    headers:
      defaultMode: drop # drop all headers per default
      names:
          User-Agent: keep # log user agent strings
enabling Traefik access logs - traefik.yml
That's basically it for configuring the Traefik reverse proxy.
InfluxDB
As we have enabled metrics for Traefik, which will be later pushed into an InfluxDB database, we must setup such database of course. The above docker-compose.yml already holds our necessary InfluxDB container service.
However, besides that, we also have to configure two additional configuration files:
- influxdb.conf
- /init/create-traefik.iql
The influxdb.conf file will be stored in the root directory of the volume mount for InfluxDB. The configuration file holds the following entries (nothing to adjust):
# Bind address to use for the RPC service for backup and restore.
bind-address = "127.0.0.1:8088"
[meta]
  dir = "/var/lib/influxdb/meta"
[data]
  dir = "/var/lib/influxdb/data"
  wal-dir = "/var/lib/influxdb/wal"
  series-id-set-cache-size = 100
[http]
  enabled = true
  bind-address = ":8086"
  auth-enabled = true
[logging]
[subscriber]
[[graphite]]
[[collectd]]
[[opentsdb]]
[[udp]]
[continuous_queries]
[tls]
[coordinator]
[retention]
[shard-precreation]
[monitor]
/mnt/docker-volumes/influxdb/influxdb.conf
Besides that we have to create an initialization file, which will be run when the container starts. We will utilize this startup run feature to initialize our database. The init configuration file will be stored within the init volume mount directory.
It can be named randomly but must have the extension .iql. I've named my configuration file create-traefik.iql and it holds the following data:
CREATE DATABASE traefik WITH DURATION 31d
CREATE USER traefikuser WITH PASSWORD 'MyVeryStrongInfluxdbPassword'
GRANT ALL ON traefik to traefikuser
/mnt/docker-volumes/influxdb/init/create-traefik.iql
Promtail
In order for our Promtail container to access, read and parse log data, we must specify where our log data is available and which of them should be parsed. The log data must be mounted inside the Promtail container, which we defined in the docker-compose.yml file above.
Specifying which log file to parse is done through a promtail-config.yml configuration file, located at /mnt/docker-volumes/promtail/promtail-config.yml in my case.
For our use case, I'll force Promtail to parse the following two logs:
- Auth logs: We've successfully bind mounted the logs of my Linux server at
/var/loginto the Promtail container. Therefore, let's use it! I want to parse the well-knownauth.loglog file that holds many interersting things such as SSH logins etc. - Traefik logs: Additionally, I want to parse the log files of Traefik. Access logging was enabled previously in the static configuration file of Traefik. The log file will be stored in the directory
/logsof your Traefik container volume.
The configuration file should look like this (nothing to adjust):
server:
  http_listen_port: 9080
  grpc_listen_port: 0

positions:
  filename: /tmp/positions.yaml

clients:
  - url: http://loki:3100/loki/api/v1/push

# local machine logs
scrape_configs:
  - job_name: auth
    static_configs:
    - targets:
        - localhost
      labels:
        job: authlogs
        __path__: /var/log/auth.log

  - job_name: traefik
    static_configs:
    - targets:
        - localhost
      labels:
        job: traefiklogs
        __path__: /var/log/traefik/*.log
/mnt/docker-volumes/promtail/promtail-config.yml
/var/log/traefik is dependent on the used docker volume mount. In the above defined docker-compose.yml, we mounted our Traefik logs as well as auth logs into the Promtail container.Loki
Finally, we must also define a configuration file for Loki. The file is called loki-config.yml and defined in the above docker-compose.yml. In my case, it is located at /mnt/docker-volumes/loki/loki-config.yml.
The config file should contain the following (nothing to adjust):
auth_enabled: false

server:
  http_listen_port: 3100
  grpc_listen_port: 9096

common:
  path_prefix: /tmp/loki
  storage:
    filesystem:
      chunks_directory: /tmp/loki/chunks
      rules_directory: /tmp/loki/rules
  replication_factor: 1
  ring:
    instance_addr: 127.0.0.1
    kvstore:
      store: inmemory

limits_config:
   reject_old_samples: true
   reject_old_samples_max_age: 168h
   retention_period: 360h
   max_query_series: 100000
   max_query_parallelism: 2
   split_queries_by_interval: 0

schema_config:
  configs:
    - from: 2020-10-24
      store: boltdb-shipper
      object_store: filesystem
      schema: v11
      index:
        prefix: index_
        period: 24h

query_range:
  parallelise_shardable_queries: false

querier:
  max_concurrent: 2048

frontend:
  max_outstanding_per_tenant: 4096
  compress_responses: true

ruler:
  alertmanager_url: http://localhost:9093
/mnt/docker-volumes/loki/loki-config.yml
Spawning Our Docker Containers
If you successfully adjusted the above docker-compose.yml file to your needs and ensured that all configuration files for InfluxDB, Promtail and Loki exist, we will now be able to proceed booting up our Docker stack of multiple containers.
A single Linux command from the directory your docker-compose.yml is located and your containers should start to see daylight:
sudo docker compose up -dIf everything went well, you should now be able to log into your Grafana instance at http://<your-servers-ip-address>:3000 via a web browser.
admin.Configuring Grafana
As soon as the Grafana instance is ready, we must complete our last step of adding data sources as well as creating a new dashboard.
Defining Data Sources
Upon logging into your fresh Grafana instance via a web browser, we must specify our data sources.
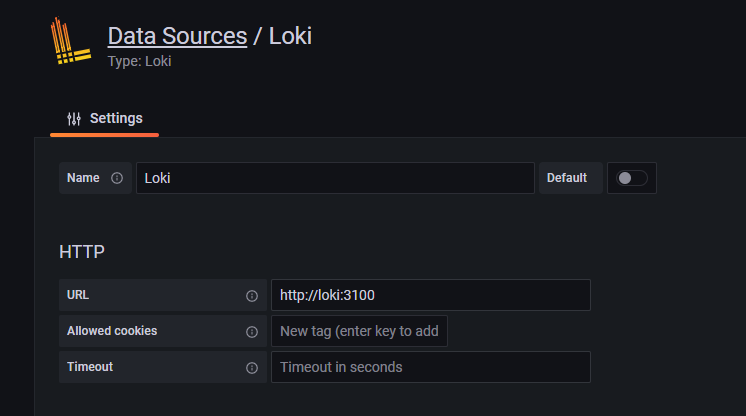
docker-compose.yml file, the containers will be put inside the same Docker network. Therefore, we can easily use the container names instead of IP addresses.Head over to the URL /datasources and choose Loki as data source. Configure it as follows:
Additionally, configure another datasource for InfluxDB. Head over to the URL /datasources again and now choose InfluxDB as data source. You must define an InfluxDB URL as well as the database, user and password for authentication.
traefikuser as well as the password MyVeryStrongInfluxdbPassword. Use these credentials, together with the defined database name traefik, when adding InfluxDB as data source.If you changed those credentials, use the new ones! 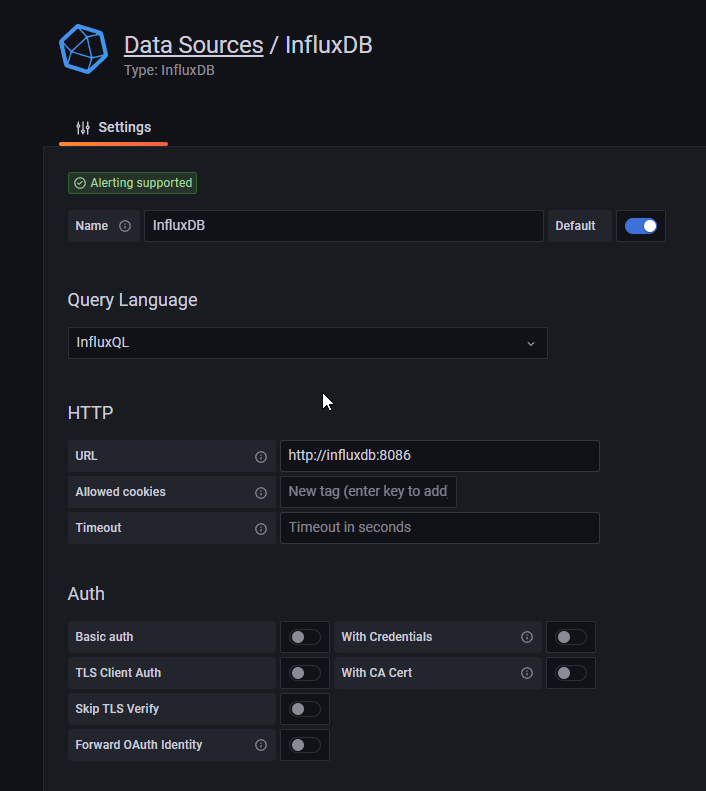
Importing a Dashboard
Finally, we have everything in place to start graphing. Grafana is up and running and we successfully configured InfluxDB and Loki as data sources to pull our data points from. Since creating a Grafana dashboard is kinda time consuming, I have uploaded my template here. Feel free to use it as a starting point:
Browse to the Grafana URL /dashboard/import and upload the above JSON file. Select the configured InfluxDB and Loki sources as default data sources. You should then be redirected to your newly added dashboard automatically, which hopefully displays all statistics correctly.


Discussion