


Dashboards are great. They look cool, fancy and especially allow a fast visual analysis of various statistics like CPU utilization, disk usage, network stuff and many more things. Numerous free and open-source software (FOSS) exist that can collect your desired data points, send them to a prefered storage solution - from where they can be finally pulled for data filtering, visualization and many more things.
In today's blog post, I will guide you through the steps of setting up a dockerized tech stack consisting of Grafana, Telegraf and InfluxDB. We will use Grafana for handling the visual stuff like the actual dashboard with graphs, timelines etc. Telegraf will be used for data collection, basically retrieving all the interesting data points like CPU utilization, Docker stats etc. And InfluxDB will finally be utilized to store our collected data and to allow Grafana to use it as data source.
docker-compoye.yml to get you started fast. Just a quick docker compose up and your Grafana dashboard is not far away.Come back later to this blog post if you feel lost. Haxxnet
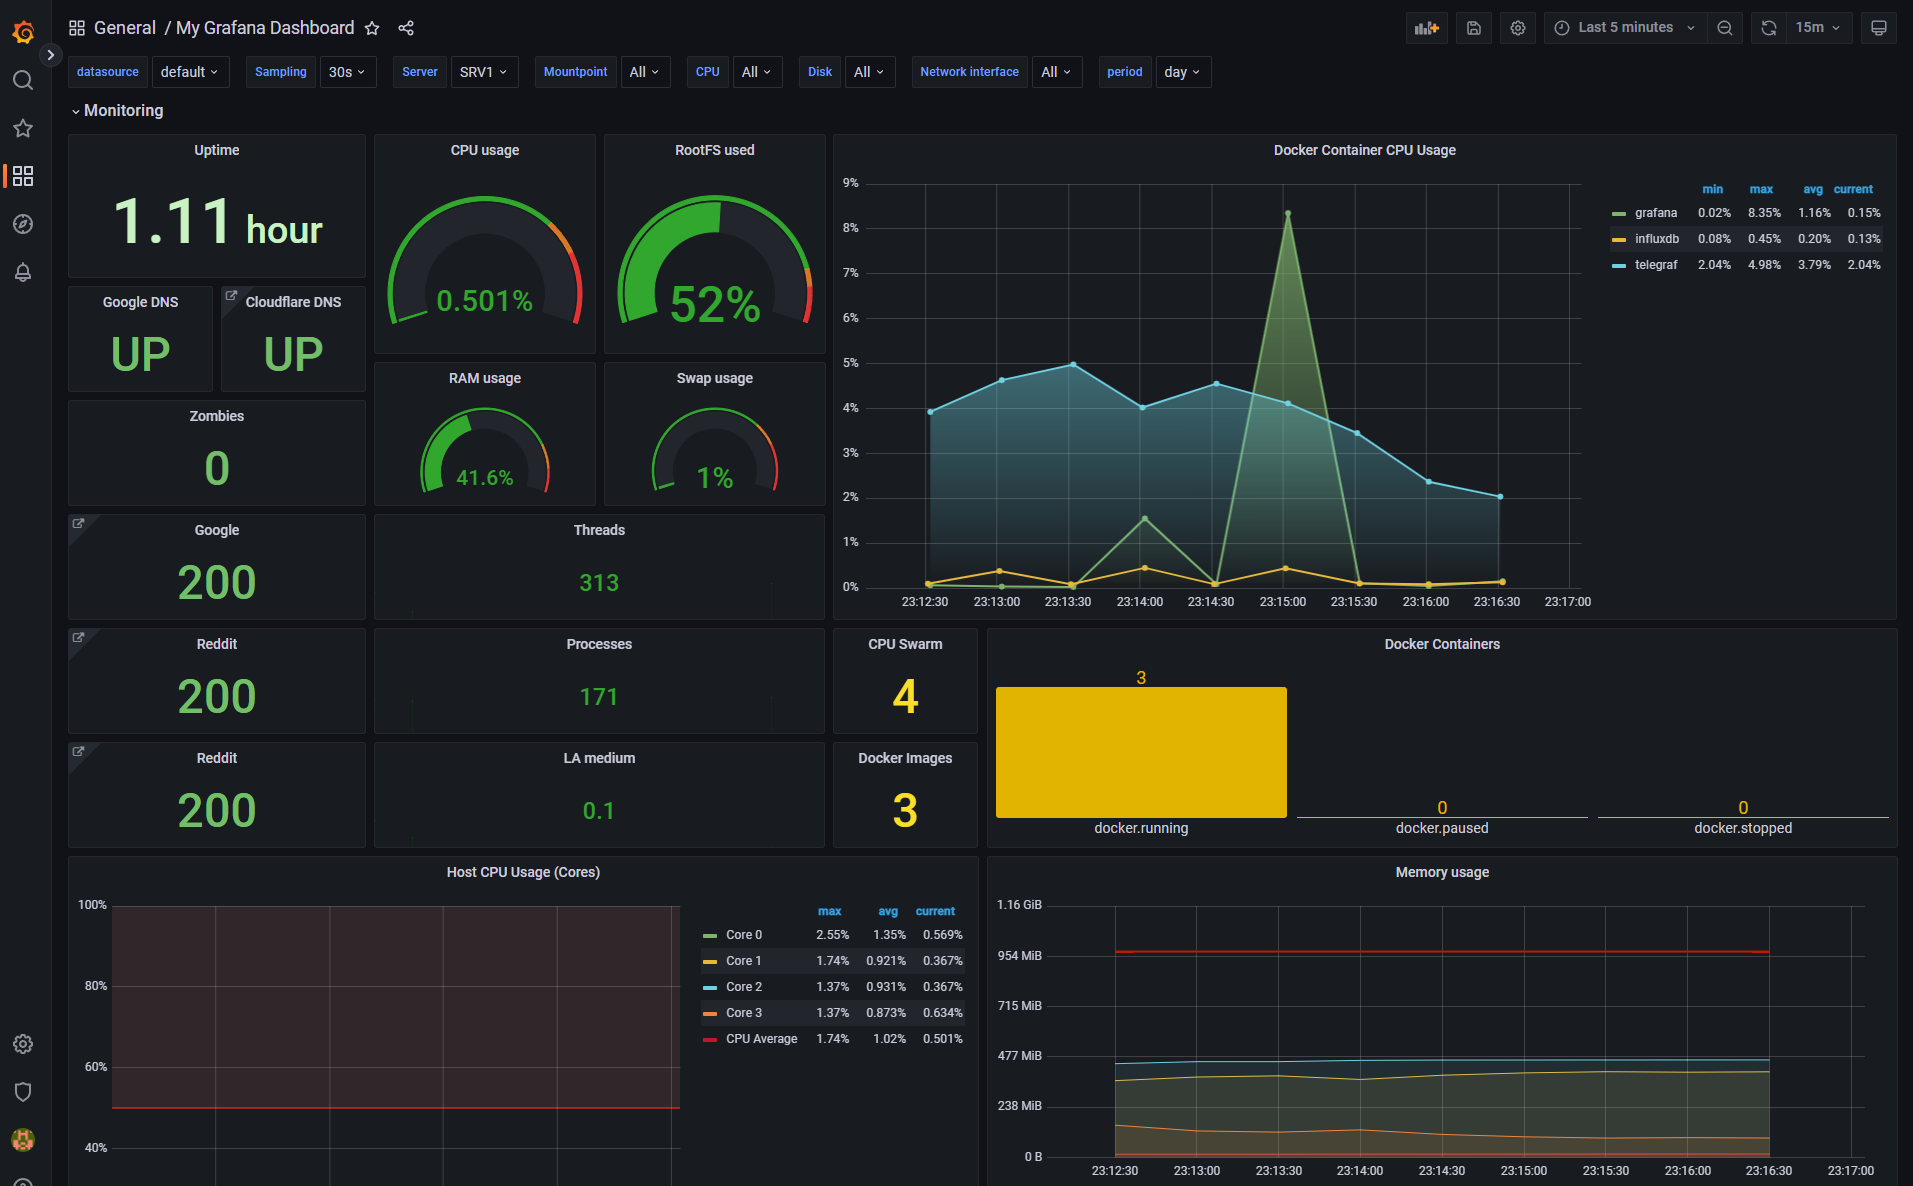
The end goal may look something like this:
Creating Our Docker-Compose.yml
A Docker compose file defines all necessary information to spawn our Docker containers with persistent data storage. Note that we'll use bind volumes to persist our container data. I personally store all my Docker volume data at the path /mnt/docker-volumes/<docker-container-name> of my Linux server.
Please adjust the configuration to your needs and infrastructure setup. Especially watch out for:
- volume mappings
- uid and gid mappings; especially for Telegraf!
- Grafana's server URL as env variable with your server's IP or your subdomain. Might be optional.
user parameter of Telegraf's docker-compose.yml. It should then look something like this: user: telegraf:998The numeric GUID can be obtained by the following command run on your server: stat -c '%g' /var/run/docker.sockversion: "3"
services:
influxdb:
image: influxdb:1.8.10
container_name: influxdb
hostname: influxdb
restart: unless-stopped
volumes:
- /mnt/docker-volumes/Influxdb/data:/var/lib/influxdb
- /mnt/docker-volumes/Influxdb/influxdb.conf:/etc/influxdb/influxdb.conf:ro
- /mnt/docker-volumes/Influxdb/init:/docker-entrypoint-initdb.d
environment:
- INFLUXDB_ADMIN_USER=admin
- INFLUXDB_ADMIN_PASSWORD=MyVeryStrongAdminPassword
telegraf:
image: telegraf:latest
container_name: telegraf
hostname: telegraf
restart: unless-stopped
user: telegraf:$(stat -c '%g' /var/run/docker.sock) # see: https://www.influxdata.com/blog/docker-run-telegraf-as-non-root/
depends_on:
- influxdb
volumes:
- /mnt/docker-volumes/Telegraf/telegraf.conf:/etc/telegraf/telegraf.conf:ro
- /:/hostfs:ro
- /etc:/hostfs/etc:ro
- /proc:/hostfs/proc:ro
- /sys:/hostfs/sys:ro
- /var/run/utmp:/var/run/utmp:ro
- /var/run/docker.sock:/var/run/docker.sock:ro
environment:
- HOST_ETC=/hostfs/etc
- HOST_PROC=/hostfs/proc
- HOST_SYS=/hostfs/sys
- HOST_MOUNT_PREFIX=/hostfs
grafana:
image: grafana/grafana:9.1.8
container_name: grafana
hostname: grafana
restart: unless-stopped
user: 1000:1000 # please adjust
depends_on:
- influxdb
volumes:
- /mnt/docker-volumes/Grafana:/var/lib/grafana
environment:
- GF_SERVER_ROOT_URL=http://grafana.example.com # please adjust
ports:
- 3000:3000docker-compose.yml
Configuring InfluxDB
As visible in the above docker-compose.yml, we bind mounted a so called influxdb.conf and an init directory into the InfluxDB docker container. The configuration file influxdb.conf must be present on our server before actually starting the InfluxDB docker container. Furthermore, we must define another file inside the init directory to automatically create a new InfluxDB database and user.
Use the following influxdb.conf and make sure to correctly bind mount it into the Docker container:
# Bind address to use for the RPC service for backup and restore.
bind-address = "127.0.0.1:8088"
[meta]
  dir = "/var/lib/influxdb/meta"
[data]
  dir = "/var/lib/influxdb/data"
  wal-dir = "/var/lib/influxdb/wal"
  series-id-set-cache-size = 100
[http]
  enabled = true
  bind-address = ":8086"
  auth-enabled = true
[logging]
[subscriber]
[[graphite]]
[[collectd]]
[[opentsdb]]
[[udp]]
[continuous_queries]
[tls]
[coordinator]
[retention]
[shard-precreation]
[monitor]
influxdb.conf
Use the following create-telegraf.iql configuration file and place it on your server host at the defined bind mount /mnt/docker-volumes/Influxdb/init/.
CREATE DATABASE telegraf WITH DURATION 31d
CREATE USER telegrafuser WITH PASSWORD 'MyVeryStrongTelegrafUserPassword'
GRANT ALL ON telegraf to telegrafuser
/mnt/docker-volumes/Influxdb/init/create-telegraf.iql
[[outputs.influxdb]] as well!Configuring Telegraf
As visible in the above docker-compose.yml, we bind mounted a so called telegraf.conf into the Telegraf docker container. This configuration file must be present on our server before actually starting the Telegraf docker container.
Use the following telegraf.conf and make sure to correctly bind mount it into the Docker container's location at /etc/telegraf/telegraf.conf. Please adjust to your needs. Telegraf is your data collector, so anything defined here will be later available in Grafana for graphing!
[[inputs.net]]
  interfaces = ["eth*", "tun0", "docker0", "dockernet*"]
  ignore_protocol_stats = false

[[inputs.http_response]]
  urls = ["https://www.reddit.com", "https://google.com",]
  method = "GET"
  follow_redirects = true

[[inputs.dns_query]]
  servers = ["8.8.8.8", "1.1.1.1",]

[[inputs.cpu]]
  percpu = true
  totalcpu = true
  collect_cpu_time = false
  report_active = false

[[inputs.disk]]
  ignore_fs = ["tmpfs", "devtmpfs", "devfs", "iso9660", "overlay", "aufs", "squashfs"]

[[inputs.docker]]
  endpoint = "unix:///var/run/docker.sock"
  gather_services = false
  container_name_include = []
  container_name_exclude = []
  timeout = "5s"
  docker_label_include = []
  docker_label_exclude = []
  #perdevice = true
  perdevice_include = []
  #total = false
  total_include = []

# Read metrics about disk IO by device
[[inputs.diskio]]

# Get kernel statistics from /proc/stat
[[inputs.kernel]]
  # no configuration

# Read metrics about memory usage
[[inputs.mem]]
  # no configuration

# Get the number of processes and group them by status
[[inputs.processes]]
  # no configuration

# Read metrics about swap memory usage
[[inputs.swap]]
  # no configuration

# Read metrics about system load & uptime
[[inputs.system]]
  ## Uncomment to remove deprecated metrics.
  # fielddrop = ["uptime_format"

[[outputs.influxdb]]
   urls = ["http://influxdb:8086"]
   database = "telegraf"
   username = "telegrafuser"
   password = "MyVeryStrongTelegrafUserPassword" # <--- change this line
   skip_database_creation = true

[agent]
  ## Default data collection interval for all inputs
  interval = "30s"
  ## Rounds collection interval to 'interval'
  ## ie, if interval="10s" then always collect on :00, :10, :20, etc.
  round_interval = true

  ## Telegraf will send metrics to outputs in batches of at most
  ## metric_batch_size metrics.
  ## This controls the size of writes that Telegraf sends to output plugins.
  metric_batch_size = 1000

  ## Maximum number of unwritten metrics per output.  Increasing this value
  ## allows for longer periods of output downtime without dropping metrics at the
  ## cost of higher maximum memory usage.
  metric_buffer_limit = 10000

  ## Collection jitter is used to jitter the collection by a random amount.
  ## Each plugin will sleep for a random time within jitter before collecting.
  ## This can be used to avoid many plugins querying things like sysfs at the
  ## same time, which can have a measurable effect on the system.
  collection_jitter = "0s"

  ## Default flushing interval for all outputs. Maximum flush_interval will be
  ## flush_interval + flush_jitter
  flush_interval = "10s"
  ## Jitter the flush interval by a random amount. This is primarily to avoid
  ## large write spikes for users running a large number of telegraf instances.
  ## ie, a jitter of 5s and interval 10s means flushes will happen every 10-15s
  flush_jitter = "0s"

  ## By default or when set to "0s", precision will be set to the same
  ## timestamp order as the collection interval, with the maximum being 1s.
  ##   ie, when interval = "10s", precision will be "1s"
  ##       when interval = "250ms", precision will be "1ms"
  ## Precision will NOT be used for service inputs. It is up to each individual
  ## service input to set the timestamp at the appropriate precision.
  ## Valid time units are "ns", "us" (or "µs"), "ms", "s".
  precision = ""

  ## Override default hostname, if empty use os.Hostname()
  hostname = "Server-1"
  ## If set to true, do no set the "host" tag in the telegraf agent.
  omit_hostname = false
telegraf.conf
Spawning Our Docker Containers
If you successfully adjusted the above docker-compose.yml file to your needs and ensured that a correct Telegraf and InfluxDB configuration exists in advance, we will now be able to proceed booting up our Docker containers.
A single Linux command from the directory your docker-compose.yml is located and your containers should start to see daylight:
sudo docker-compose up -dIf everything went well, you should now be able to log into your Grafana instance at http://<your-servers-ip-address>:3000 via a web browser. If you are not greeted by Grafana, please inspect your Docker logs to identify the misconfiguration. Sometimes it takes a while until all containers are up and running. Depending on your server's hardware, give it a few minutes to come up.
admin. Creating our Grafana Dashboard
After successfully logging into our Grafana instance and changing the default password, the first thing to do is adding InfluxDB as data source.
Adding a new data source
Jump into Grafana's settings located at /datasources and select InfluxDB as data source. You must define InfluxDB's URL as well as the database, user and password for authentication. Then proceed and hit Save & Test.
docker-compose.yml file, the containers will be put inside the same Docker network. Therefore, we can easily use the container's name instead of IP addresses. Therefore, just specify http://influxdb:8086 as URL.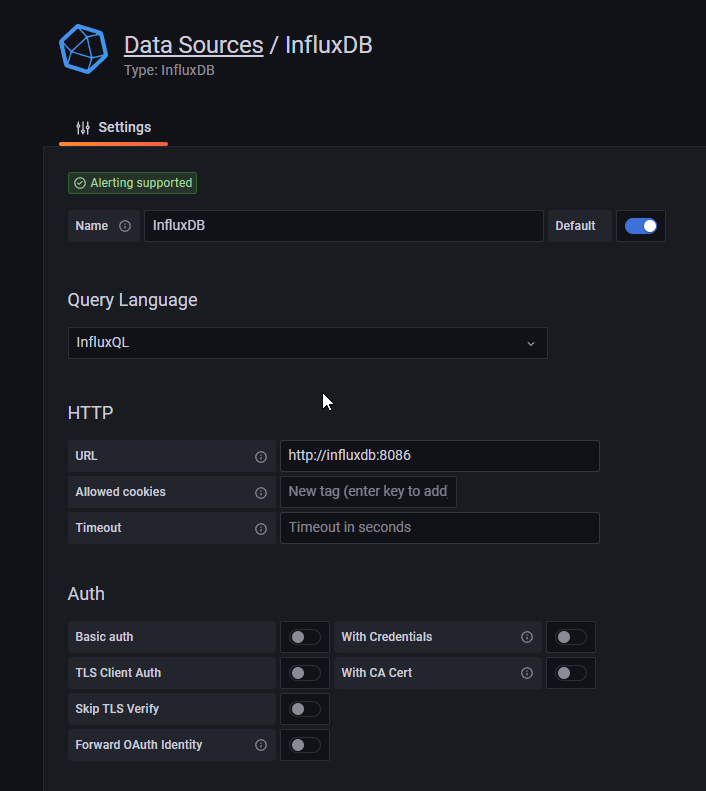
telegrafuser as well as the password MyVeryStrongTelegrafUserPassword. Use these credentials, together with the defined database name telegraf, when adding InfluxDB as data source. If you changed those credentials, use the new ones!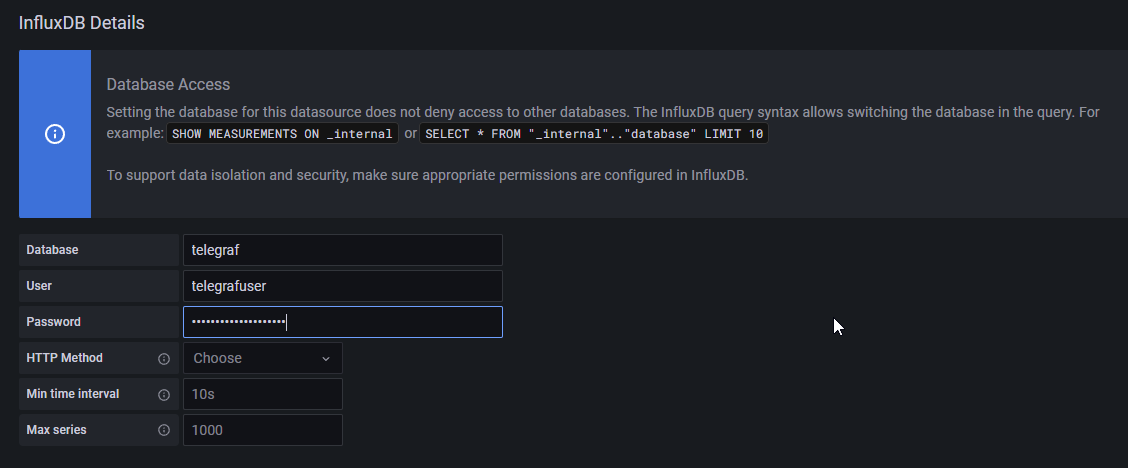
Creating a new dashboard
Finally, we have everything in place to start graphing. Grafana is up and running and we successfully configured InfluxDB as data source to pull our data points from. Since creating a Grafana dashboard is kinda time consuming, I have uploaded my template here. Feel free to use it as a starting point:
Browse to the Grafana URL /dashboard/import and upload the above Grafana_Dashboard_Template.json file. Select InfluxDB as default data source. You should then be redirected to your newly added dashboard automatically, which hopefully displays all statistics correctly.
Enjoy and also have a look at:


Discussion